On this post I’ll explain you how to grab analog data from an 8-channel, 12 bit ADC. The ADC used is the Custard-PI 3 http://www.sf-innovations.co.uk/custard-pi-3.html . You can buy it directly from them on that page.
I use it to log value from different type of sensors. As you know ADC for raspberry can read only voltage from 0 to 2.5V (or higher with partitor) but lot of industrial sensors are based on 4-20mA range.
With this scripts you will be able to obtain a CSV and graph of the real value with only some easy configuration. You just need to know what’s the range of your sensor (ex: 0-100°C), what’s the range of output value of the sensor (ex: 4-20 mA), what does ADC read when the output value is at minimum and at the maximum. To obtain this last values we need only a simple more step.

The setup is very easy, you just need to connect the board to raspberry, power it on, copy the software on it and everything is done. Let’s go step by step:
- Connect the board to raspberry and power it on.
- Connect to PI with ssh, update it and install apache with php:
# sudo apt-get update && apt-get upgrade# sudo apt-get install libapache2-mod-php5 - Download the tarball and extract it on root ( / ) directory.
cd /tmp
wget https://www.farlock.org/wp-content/uploads/2015/04/adc_grabber.tar
cd /
tar xvf /tmp/adc_grabber.tar - It will extract two files in /etc/init.d and /etc/default ; these are needed for startup at boot.
It will extract the cpi3adc.py file in /usr/local/bin and the directory cpi3adc in /usr/local/lib (this contains two included file). Every web page is extracted on /var/www/adc - We need four more steps manually:
Edit sudoers file with command:
# sudo visudo
and add this line at the end:
www-data ALL=(ALL) NOPASSWD: ALL
add user www-data to group pi with this:
# sudo adduser www-data pi
Enable startup of the logger on boot:
# sudo update-rc.d cpi3adc defaults
And finally edit /etc/apache2/sites-enabled/000-default, find the paragraph starting with:
<Directory /var/www>
and add these lines inside it:
Options +ExecCGI
AddHandler cgi-script .cgi .pl
RedirectMatch ^/$ /adc/ - Via web browser connect to your raspberry (you need to know the ip address, ex: 192.168.1.110):
http://192.168.1.100/adc - On this page you can set up global parameters or different ones for each channel (in case you have different sensors).
In my example I have a thermometer with range 0° – 100°C and output of 4 – 20 mA.
I have connected it to channel 1 with 100 ohm resistor, look at this image to have an idea:
The problem now is that the resistor is not usually perfect and we need to make some adjustment. - I disconnect my sensor and i connect to analog input a current generator, I set it with 4mA and i click on “Leggi Valori Attuali”, this is the result:
CANALE – Volt Ingresso – Valore Ingresso Puro – Ingresso mA – Valore Calcolato °C
CH 1 – Voltage 0.40 – Value 655 – In 4.00 mA – 0.00 °C
CH 2 – Voltage 0.08 – Value 131 – In 0.80 mA – -20.05 °C
CH 3 – Voltage 0.05 – Value 81 – In 0.50 mA – -21.96 °C
CH 4 – Voltage 0.03 – Value 43 – In 0.26 mA – -23.41 °C
CH 5 – Voltage 0.01 – Value 21 – In 0.13 mV – -12.13 V
CH 6 – Voltage 0.01 – Value 15 – In 0.09 mA – -24.48 °C
CH 7 – Voltage 0.01 – Value 11 – In 0.07 mA – -24.64 °C
CH 8 – Voltage 0.00 – Value 7 – In 0.04 mA – -24.79 °COur interest is for the second line (channel 1) and the second field (value), this is the value that ADC reads with an input of 4mA and our resistor.
Now the same thing setting the generator to 20mA, change the generator and press F5 to reload the page, this is the output:CANALE – Volt Ingresso – Valore Ingresso Puro – Ingresso mA – Valore Calcolato °C
CH 1 – Voltage 2.00 – Value 3269 – In 20.0 mA – 100.00 °CThe second value is 3269, this is the ADC reading with 20mA.
- Now on the homepage you can set the value needed. And you need how to obtain the value for the third column (ADC).
- When everything is done you can press “Salva Valori”, and then you can start the logger with “Avvia”.
- If you want to start automatically the logger at boot check “Avvia automaticamente” and press “Salva Valori”.
- The logger grab the data every seconds setted in “Intervallo in secondi per letture”, and calculate the average every “Nr di valori per media” setted.
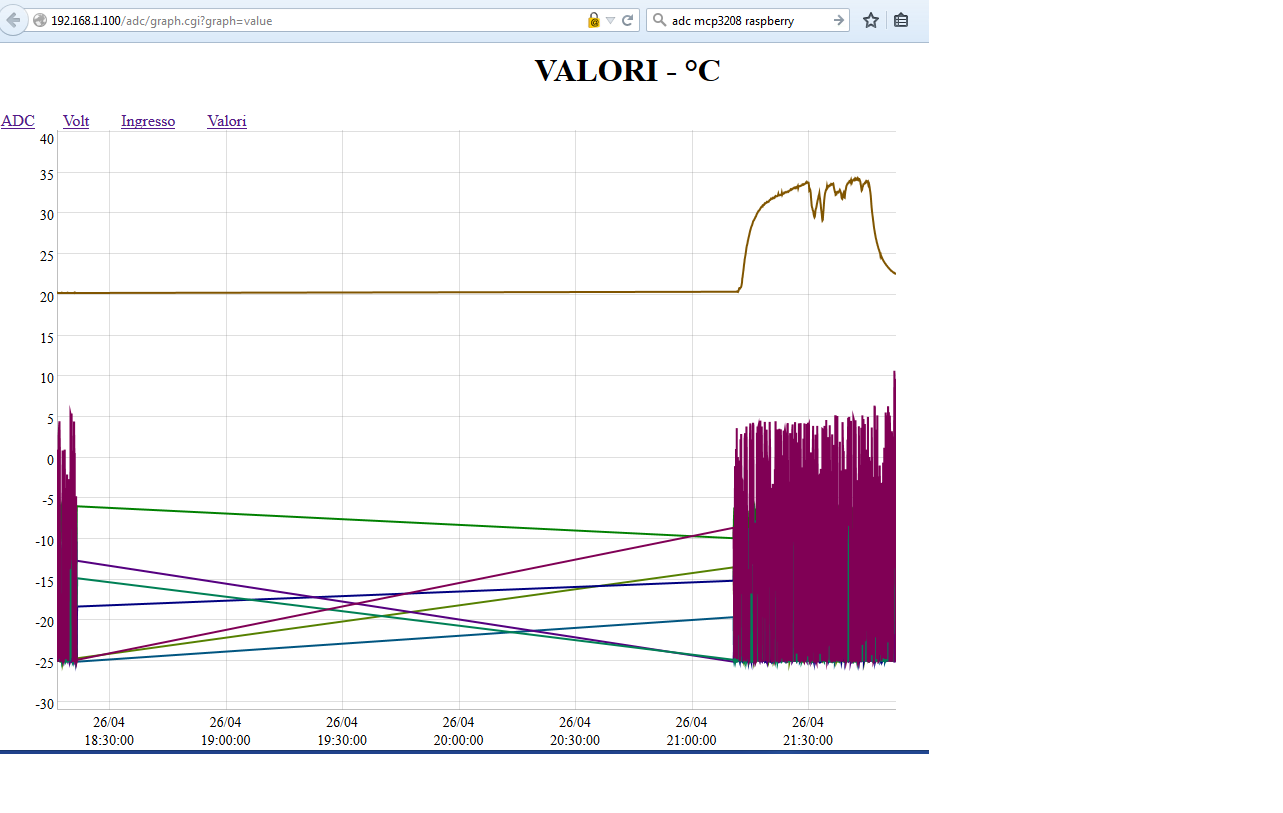
- You can see the graph in realtime clicking on “Visualizza Grafico”, and download CSV clicking on “Download CSV”.
Download scripts: adc_grabber
Thanks to:
http://www.sf-innovations.co.uk/custard-pi-3.html
http://dygraphs.com/
Looking for a logger for:
Input Voltage 9-28 VDC 4.5 A max
Pulse output: 5-28V peak to peak 7500 HZ max
Would Raspberry work for this Application?
With this ADC, input is from 0 to 2.5V. You have to rearrange it. And with this IO board you don’t have any output available.
On their site you will find a lot of boards, and maybe the correct one for you:
http://www.sf-innovations.co.uk/index.html